Reports
Know how the park is doing without building a spreadsheet: today’s guests and money, the week ahead, what guests look at on your website, and figures ready for your accounts.
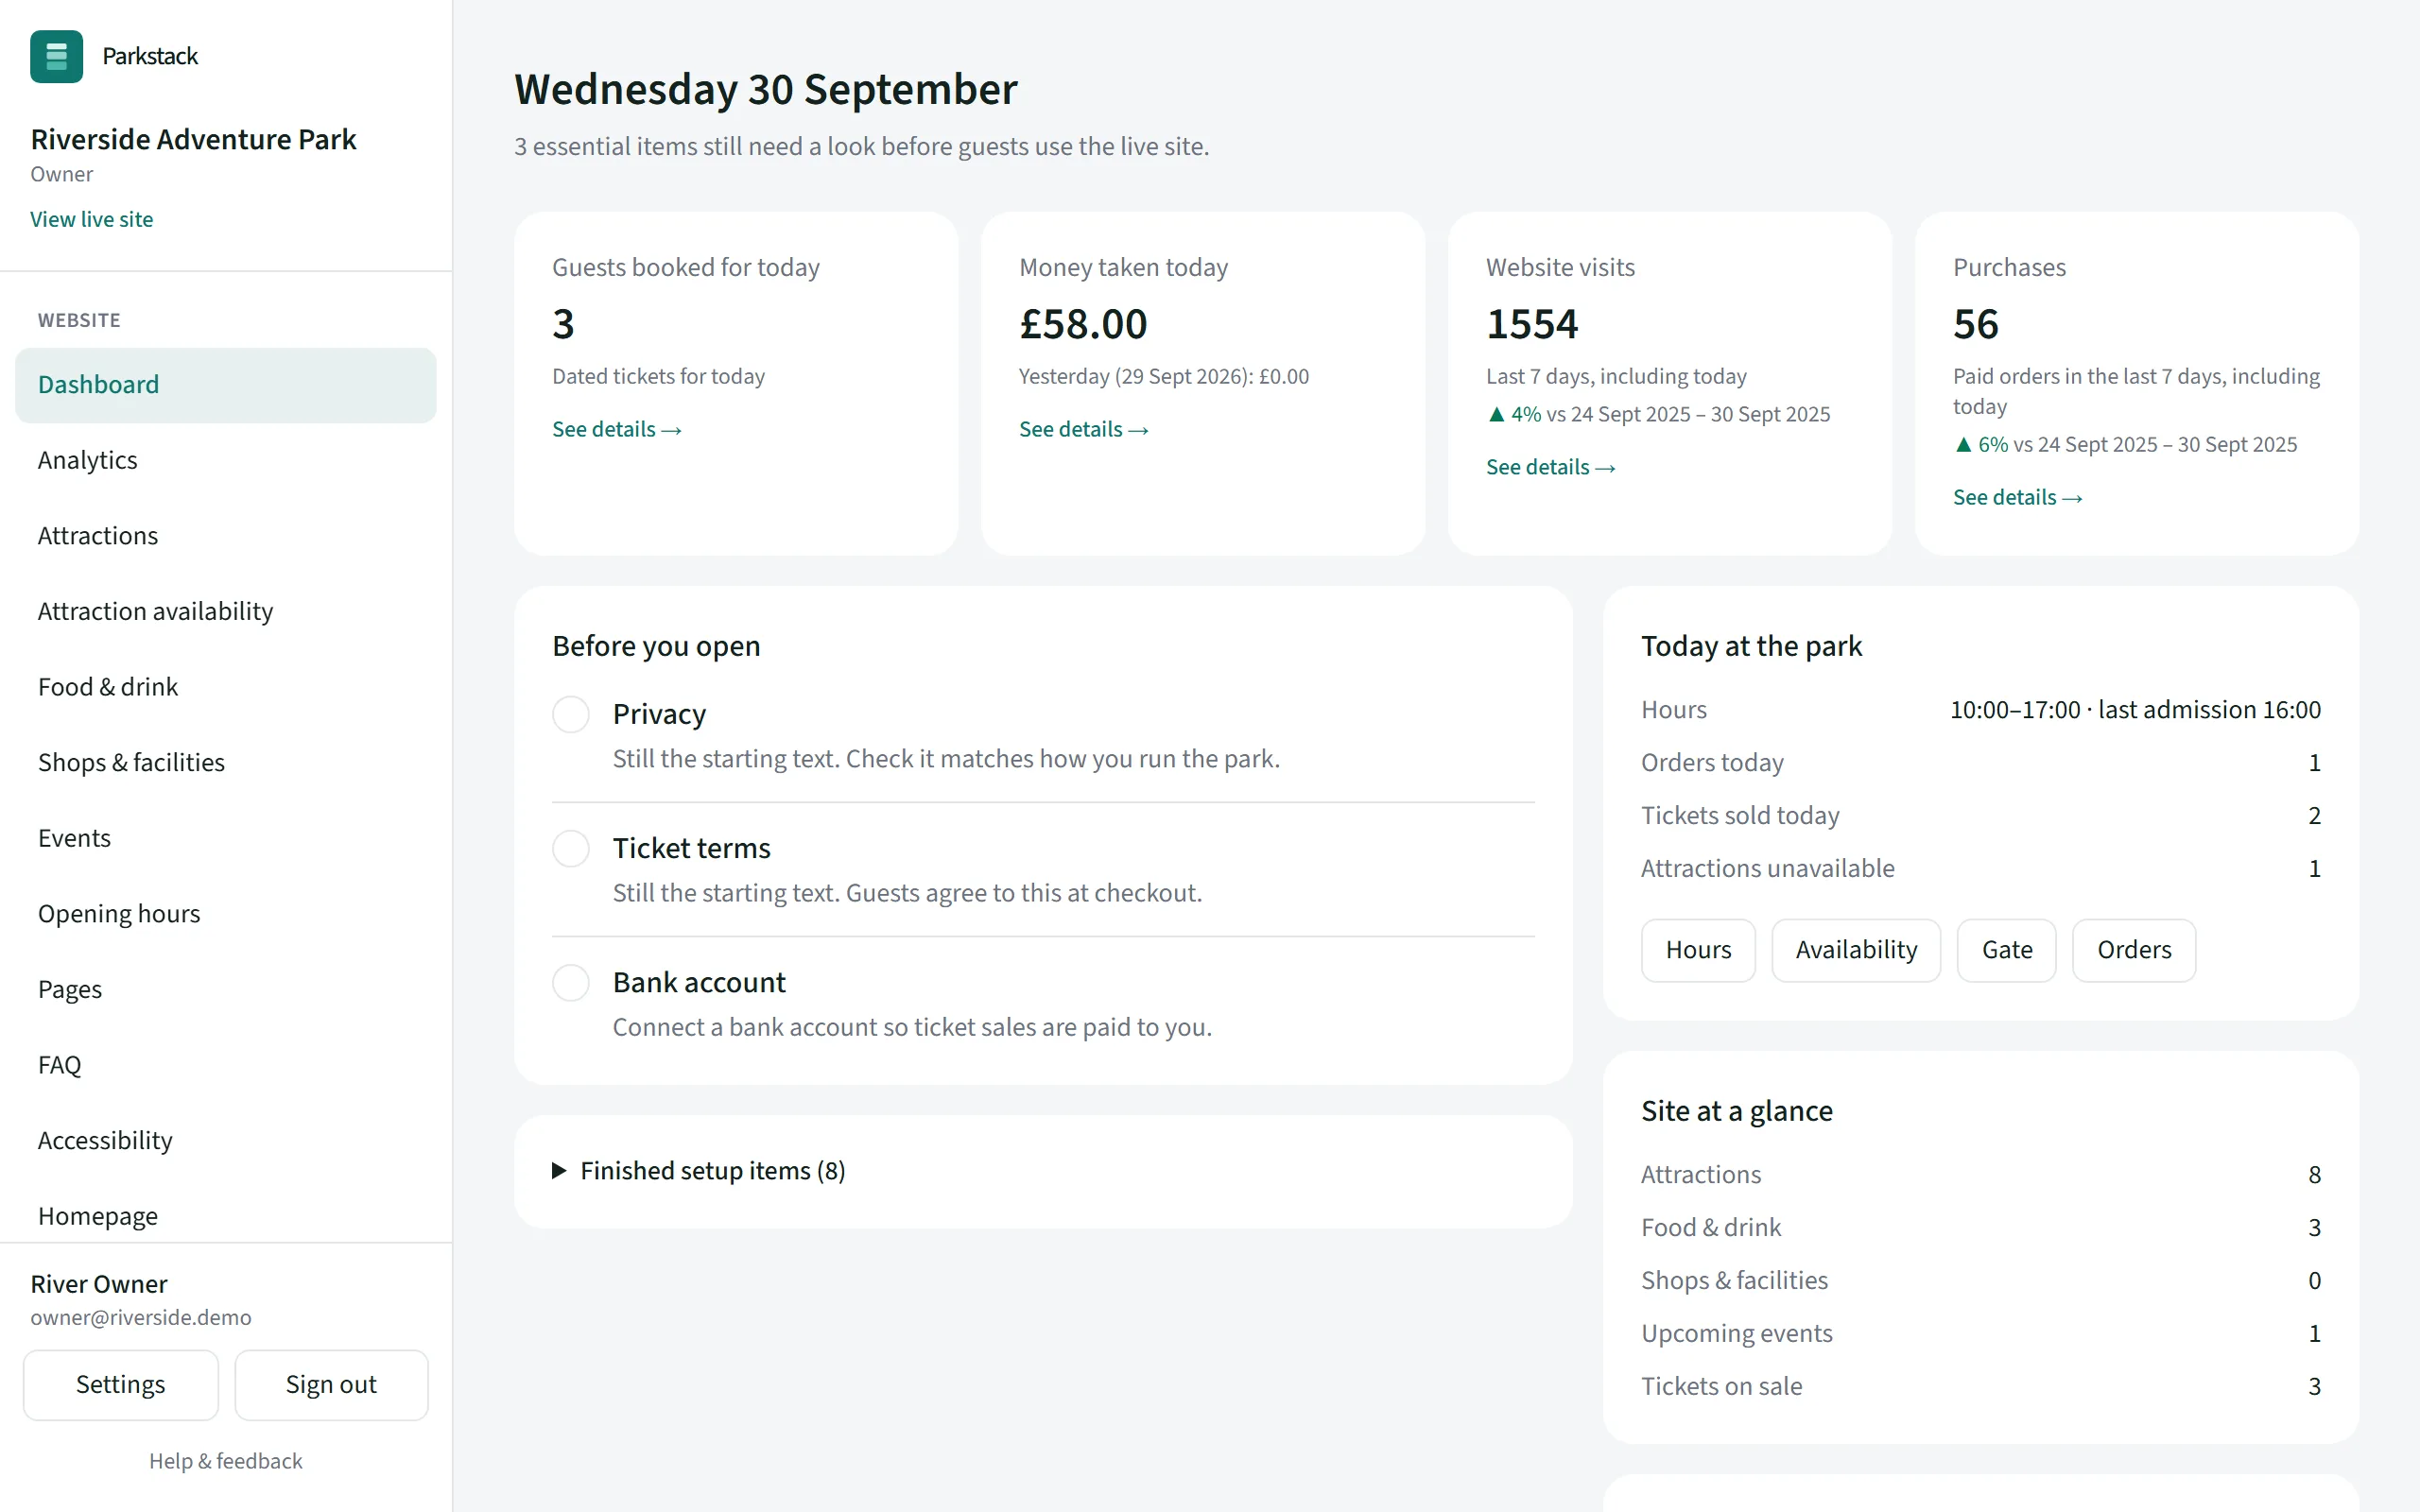
Your dashboard
The console opens on today: guests booked, ticket money, and this week’s website visits and purchases against the same days last year. Below it, the next seven days, with each day’s hours, bookings and events, and a short list of anything that needs attention.
- Today’s guests and ticket money
- The next seven days at a glance
- Compared with the same dates last year
- What needs attention, such as a ticket shop with nothing to sell
Sales
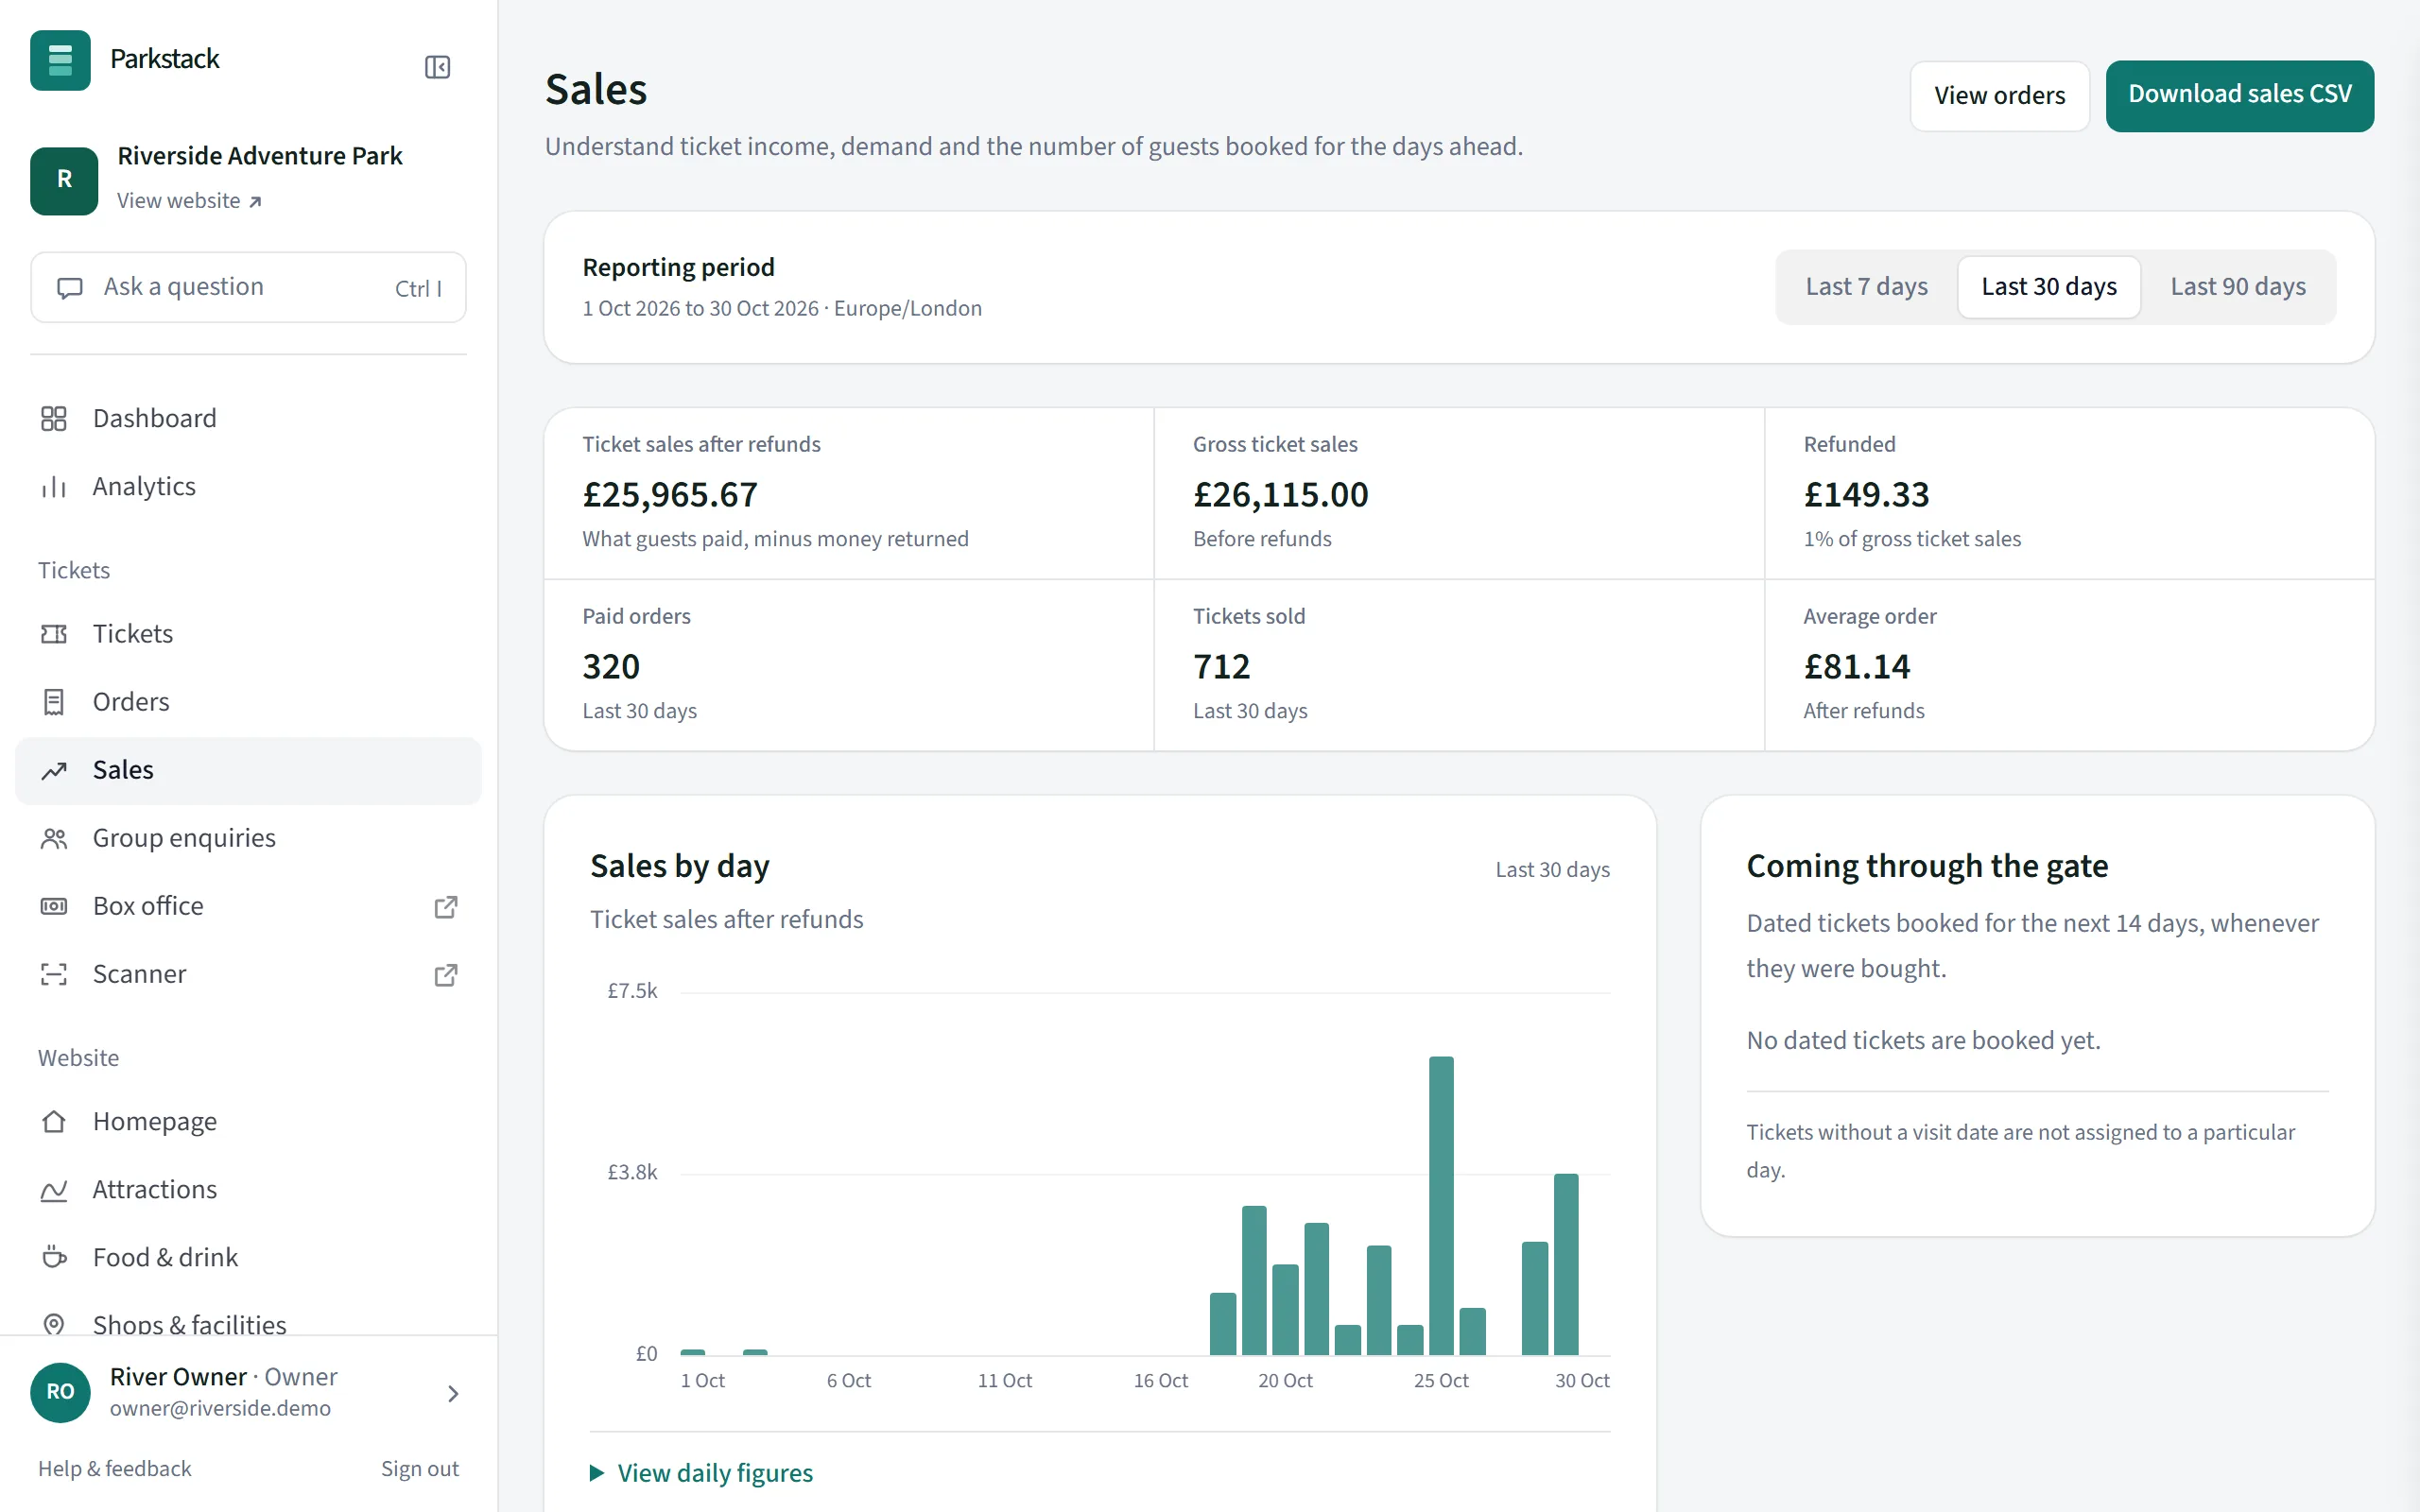
See ticket sales after refunds for the last week, month or quarter, how many orders and tickets, the average order, and how sales went day by day. Plain notes point out what stands out, such as a day close to selling out or most guests buying on the day.
- Sales by day and by ticket
- Guests booked for the days ahead
- What stands out, in plain words
- Daily totals to download
Your website’s visitors
See how many people visit your website, where they came from, what they look at and search for, and how many go on to buy tickets. Compare any period with the one before or the same dates last year.
Visits are counted by Parkstack itself, without advertising trackers, and only after a guest agrees on their first visit.
- Visits, pages and attractions viewed
- Search engines, social media, email and your own campaigns
- Searches on your site that found nothing
- From looking at tickets to buying them
Every plan shows the week’s visits on the dashboard. The full report is included with Professional. See plans
Analytics
1 June to 30 June
Compared with the same dates last year
Website visits
1,842
+18%
Page views
6,314
+21%
Attraction views
2,906
+24%
Purchases
286
+12%
Most viewed attractions
Views
For your bookkeeping
Download what was taken day by day, by payment method, as a summary or line by line, ready for Xero, QuickBooks or Sage. Card payments already reach your accounts through Stripe, so it mostly saves typing in cash and card-machine sales.
- The accounts export, by day or line by line
- A refunds report with who gave each refund and why
- Box-office takings for any day
The accounts export and refunds report are included with Professional. See plans
How-to guides
More of Parkstack
- Your websiteBuild and run your park’s website yourselves
- Selling ticketsOnline tickets, vouchers, groups and refunds
- The gate and box officeScan tickets and sell on the day
- Your team and your dataWho can do what, and keeping things safe